Long Range Transportation Plan 2045
The Long Range Transportation Plan for the Genesee-Finger Lakes Region 2045 (LRTP 2045) establishes transportation priorities and provides a strategic direction for transportation policy, planning, and investment decision making for the nine-county Genesee-Finger Lakes Region. Federal, state, and local governments will use LRTP 2045 to guide decision making regarding the transportation system in the region over the next 25 years.

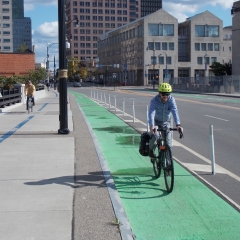
Bike Maps
GTC is working on a digital update to the Greater Rochester Area Bicycling Map.
Click to learn more.

Public Input
Opportunities to provide input on GTC projects and initiatives.
Events
- Planning Committee Meeting
- Thursday, May 23, 2024 - 9:30am
- CityPlace, 1st Floor Conference Room, 50 West Main Street, Rochester
- GTC Board Meeting
- Thursday, June 13, 2024 - 8:30am
- RGRTA, 1372 East Main Street, Rochester
- Planning Committee Meeting
- Thursday, July 11, 2024 - 9:30am
- CityPlace, 1st Floor Conference Room, 50 West Main Street, Rochester
Plans & Studies
An inventory of plans and studies prepared by GTC and member agencies as part of the Unified Planning Work Program (UPWP) to further develop the policies and recommendations contained in the Long Range Transportation Plan (LRTP) into concept-level projects and programs.