GTC Launches Trail Data Collection Effort Using Array of Automated Methods
Trail Reports Will be Shared with Partners, Used for Transportation Planning Decisions
Content Provided by GTC Staff
Posted: December 11, 2018
Cyclists and pedestrians in the greater Rochester, NY area are fortunate to have a variety of trails to travel. Not much different from the people who use them, each pathway exudes its own distinct personality; a product of its physical attributes and environment.
The types of surfaces and amenities vary as much as the number of miles they cover. Depending on the setting, some trails are made of compacted stone dust or cinders, while others are grassy or paved with asphalt. The width, slope, and cross-slope shape the route thousands of individuals take on their journey, whether the trip is a repeated commute to work or school, or just a journey of pleasure and exercise.
Some trails traverse urban neighborhoods and may connect students with city activities, while others follow a former mode of travel, such as a railroad bed or canal, in rural settings. The distances can range from a less than a mile loop to a linear trail with spurs and connections to others that cross county and even state lines. Nevertheless, what do we know about how these trails are used? For example, which trails have the most users? Alternatively, when are the busiest times of use? How are people using the trail – are they walking, running, riding?
GTC realized the need to establish baseline qualitative trail data of both the physical attributes of the trails, as well as quantitative data of trail use in order to make sound transportation planning decisions.
“We know many, people use the trails in various ways, at various times, for various uses, but we don’t have the robust documentation that is needed to make investments of actively sought-after, limited, transportation dollars,” James Stack, GTC executive director said.
Stack added, “Possessing and having the ability to share this trail data will empower local communities and trail owners to identify needs, set realistic priorities, make plans over time, incorporate bike/ped solutions into existing projects, and pursue funding opportunities to continue to invest and uphold the transportation system for people traveling in non-motorized ways.”
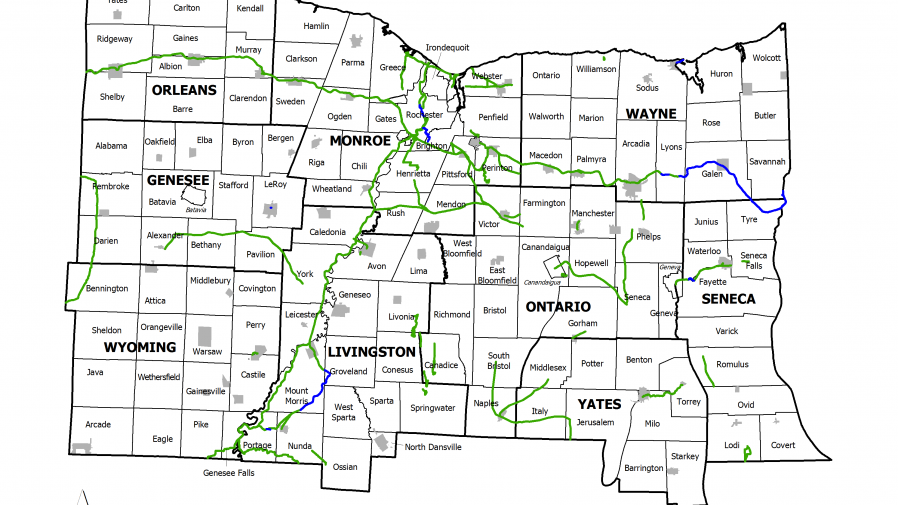
In 2017, GTC started evaluating trails and counting bicyclists and pedestrians to build a solid foundation of data for future planning with a multi-pronged approach. GTC selected 25 trails covering approximately 300 miles in Rochester and the surrounding counties. The primary goal is to compile two key types of information using collection methods that are conducive to our environment and would serve our needs. The first is physical attributes and the second is trail use.
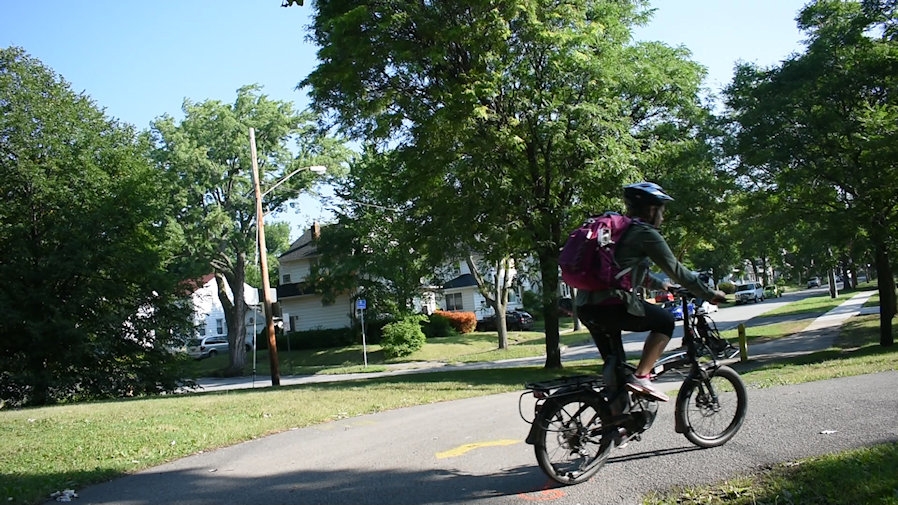
 Physical Attributes- GTC hired an intern who spent the summer riding the data bike exploring the trails with a tape measure, level and a checklist in tow. She manually collected characteristics including geometrics, dimensions, surface material, condition, slope, distance, etc., with the help of an electric data bike equipped with a GoPro mounted on the handlebars and a smartphone with mobile apps to measure distance and surface conditions.
 Trail Use- Ultimately, the use of the facility, or the reasons for the lack of use, is what drives decision-making. The type of activity, along with the amount and frequency of users, is some of the most compelling data. GTC has acquired and is using a variety of automated methods to count trail users year round, which will yield the most useful planning data. GTC will re-locate the trail counters periodically over the coming years.
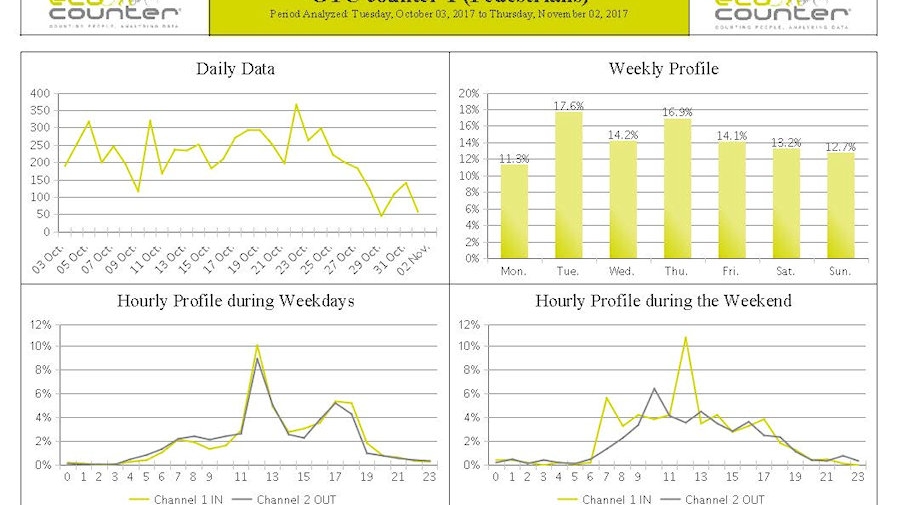
GTC placed pneumatic tubes (Eco-Counters) along the Genesee River Trail in Rochester and the Erie Canal Trail in our region. They have already captured the type of activity, direction of travel, day of the week, and times of the day in 10 locations.
Time-lapse trail cameras collect time-stamped images over several months spanning all four seasons. Cameras have already generated useful, preliminary data at nine locations along the Genesee Valley Greenway in Monroe and Livingston counties. GTC staff review the footage to compile data before they erase the memory cards.
 While GTC targeted counts on 25 multi-use paths, it is also important to have a handle on the number of non-motorized users in other obvious locations, such as busy sidewalks and intersections.
Automated counting devices using infrared and other technology have been successful. Staff has placed a telescoping pole with an attached camera (MioVision Scout) at spot locations to capture short-term statistics. A service provider uploads the footage to analyze for traffic counts.
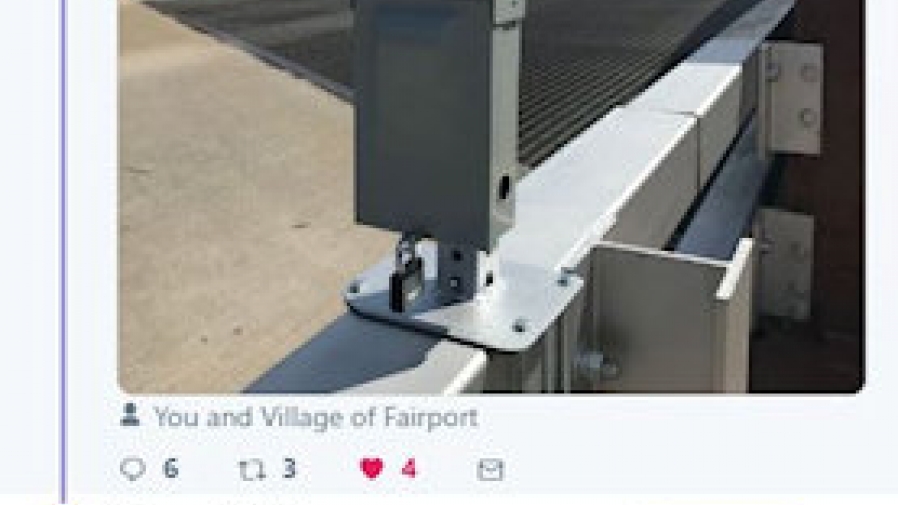
Additionally, GTC is using devices, securely mounted to bridge railings or something similar, to tally the people walking or riding bicycles. GTC is using this tool (TRAFx Trail Counter) in Fairport, NY, to capture continuous counts, over several months, on the two bridges over the Erie Canal.
As GTC compiles all this data compiled, staff will prepare individual trail reports summarizing all of the known physical  attributes and trail use information collected. The results will serve as a baseline for future comparison. The final reports will be readily available and the contents will be shared with partner agencies, community groups, municipalities, facility owners and anybody who has planning goals to enhance bicycling and walking in our area.
The Village of Fairport is a great, recent example. In a partnership, GTC and Village officials, counted people who crossed the lift bridge over the Erie Canal and the Village generated some buzz on Twitter engaging their community by asking people to submit guesses on the totals. The answer for the average weekly number of pedestrians using the bridge over the summer was 8,293. This is remarkable when you consider the population of Fairport is less than 5,400!
Sample of Data Findings
A sneak peak at a small fraction of the data collected so far reveals a lot of useful information. For a quick, preliminary example, GTC counted trail users at two rural locations along a grassy-section of the Genesee Valley Greenway in Caledonia and Avon, in Livingston County. Data described and shown in the charts below are for a sample three-week period from May 1- May 22, 2018.
People on the Trail:
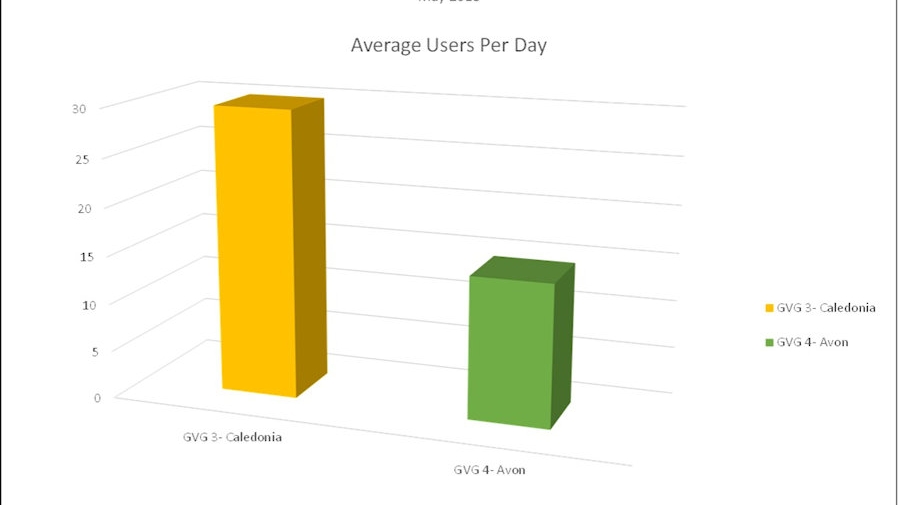
The average number of users who use the trail per day in Caledonia is 30, twice the amount of people in Avon at 15 (Figure 3.)
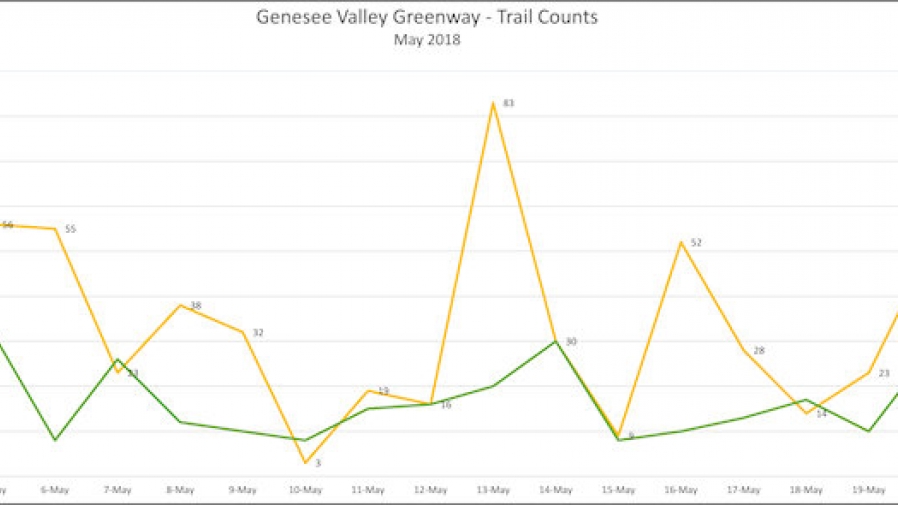
In Caledonia, daily use spiked into the fifties a few times and even surpassed 80 one day, Sunday, May 13. In Avon, the use peaked at 30 people on Saturday, May 5 (Figure 1.)
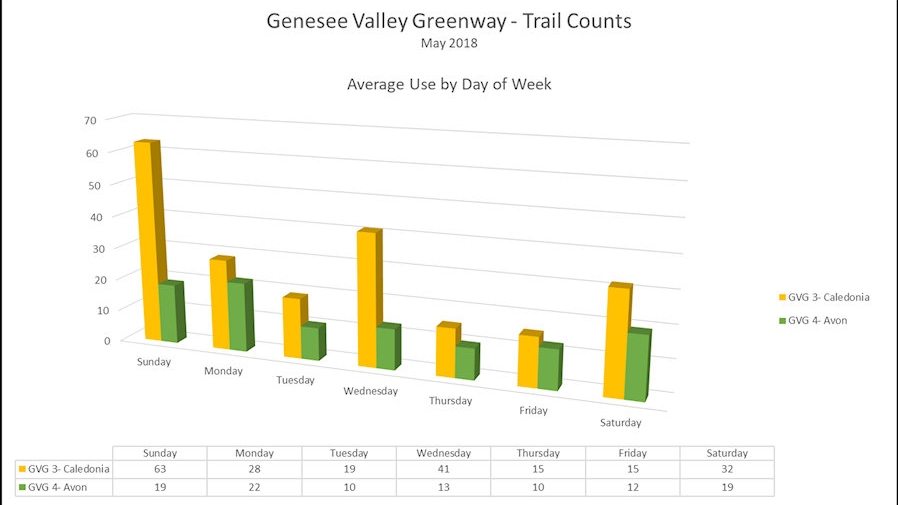
In the Caledonia section, people tend to use the trail the most on Sundays followed by Wednesdays and Saturdays. While in the Avon area, individuals tend to use the trail the most on Mondays, weekends and Wednesdays (Figure 2.)
Mode of Travel:
People who use the trail during this time at these locations mostly walked or rode a bicycle.
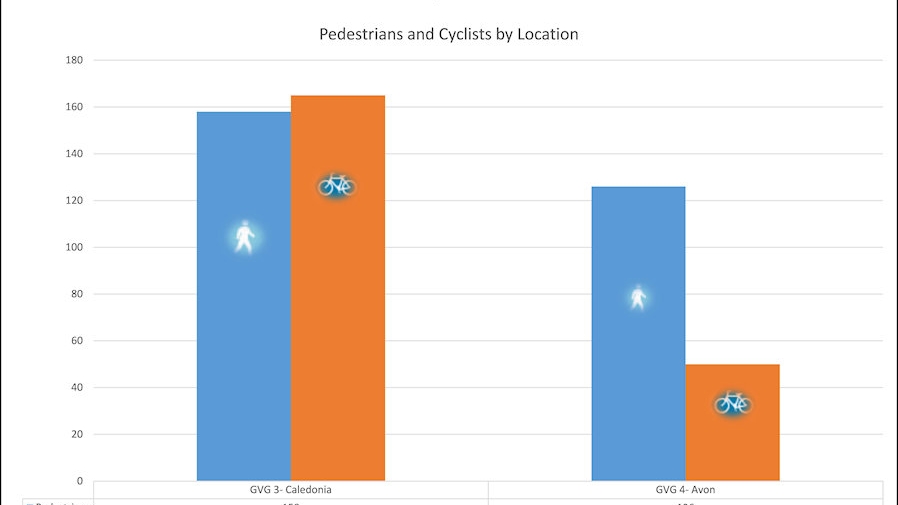
In the Caledonia section, the split beween pedestrians and bicyclists was close to even. A total of 165 bicyclists (51%), were counted on the trail, just a few more than pedestrians at 158 (49%.) In Avon, the difference was significant. A total of 126 people (72%) were counted walking along the trail, while 50 (28%) were spotted riding a bicycle. (Figures 4 & 5.)
Nevertheless, people are in fact, utilizing the multi-use trail in different ways and probably for a baker’s dozen of different reasons. However, there is plenty of space for more people to ingest the fresh air to clear their minds, strengthen their bodies, and fill their souls.
This data collection project is a component of “Bicycle and Pedestrian Transportation Program” (UPWP Task 5500 page 49) and is funded with federal planning funds made available through GTC’s Unified Planning Work Program.
For more information about this data collection effort, contact GTC Executive Director James Stack at 585-232-6240 or e-mail jstack@gtcmpo.org.